Facility Condition Index: The Formula US Schools Should Use to Prioritize a Growing Maintenance Backlog
Ask most school district facilities directors how bad their maintenance backlog really is, and you'll often get an estimate, not a number. That's not a knock on them, it's a structural problem. Without a standardized way to measure building condition, "bad" can mean anything from a leaking roof to a building that's genuinely unsafe, and boards, bond attorneys, and state funding agencies have no consistent basis to compare one building's needs against another's.
The Facility Condition Index (FCI) exists to fix exactly that problem. It's not a new concept, but it remains underused in K-12 facilities management often because districts assume it requires a costly outside consultant, when in practice it's a formula any district can calculate once it has reliable data.
The scale of the problem, in real numbers
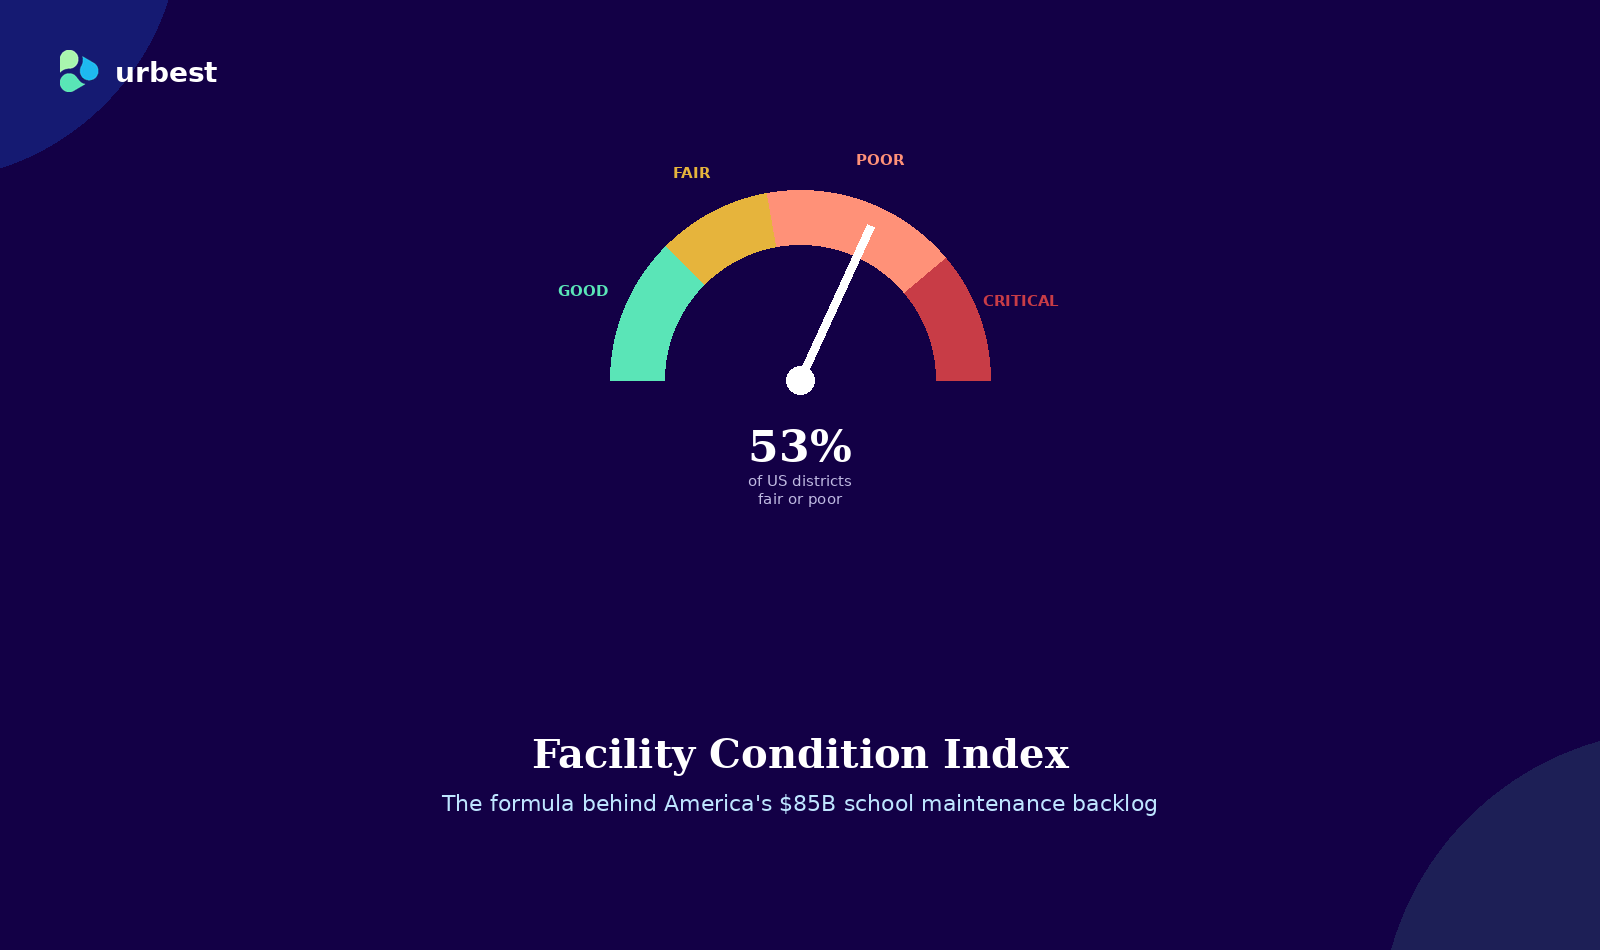
According to a 2020 report from the US Government Accountability Office (GAO), 53% of US school districts reported having buildings in "fair" or "poor" condition. The American Society of Civil Engineers' 2021 Infrastructure Report Card puts the estimated deferred maintenance backlog across US K-12 school buildings at $85 billion currently the most widely cited federal-adjacent estimate.
It's worth noting that estimates of this backlog have varied significantly over time and by methodology: a 1995 GAO estimate put the cost of correcting substandard conditions at $112 billion, while a 2008 Carnegie Mellon analysis using a different valuation model estimated total deferred maintenance at $254.6 billion. These aren't contradictory so much as a reflection of the underlying problem: without a standardized measurement like the FCI, condition estimates depend heavily on who's measuring, when, and how and the true number is likely higher than any single estimate, since many districts don't conduct systematic condition assessments at all.
What the Facility Condition Index actually measures
The FCI is a simple ratio:
FCI = Cost of deferred maintenance / Current replacement value of the buildingIf a building would cost $10 million to replace today, and it has $500,000 in documented deferred maintenance, its FCI is 0.05 (or 5%).
As a general industry convention, lower is better:
- Below roughly 0.05 — the building is generally considered in good condition
- Around 0.05–0.10 — fair condition, manageable with planned maintenance
- Above roughly 0.10–0.30 — poor condition, requiring significant capital investment
- Above roughly 0.30 — critical condition, where deferred costs are approaching or exceeding what it would cost to replace significant parts of the building
Exact thresholds vary somewhat between industry sources, but the direction is consistent: as the FCI rises, a district crosses a point where continuing to patch a building costs more, over time, than addressing it structurally.
Why this number matters more than a general sense of "things are getting old"
FCI does three things a vague condition assessment can't:
It makes buildings comparable. A 40-year-old elementary school and a 15-year-old high school annex can't be judged by age alone — FCI lets a district compare deferred cost as a share of value across a portfolio of very different buildings.
It supports the case for funding. School boards, bond attorneys, and state facility funding agencies generally respond better to a documented ratio than to a qualitative description. "This building's FCI is 0.34" is a very different conversation than "this building needs a lot of work."
It quantifies the cost of waiting. Deferred maintenance doesn't stay flat while it waits for funding — repair and construction costs escalate over time, and a roof replacement postponed for several years typically costs meaningfully more than the same project completed on schedule, on top of the added risk of consequential damage (water intrusion, mold, structural wear) while the underlying issue goes unaddressed.
Why so many districts don't calculate it
Not because it's complicated — the formula itself is simple. The real obstacle is almost always data: knowing the accurate current replacement value of each building, and having a reliable, itemized, up-to-date record of deferred maintenance costs across dozens of buildings, multiple trades, and years of history.
This is where the FCI conversation runs into the same issue as most facilities challenges: it's not a formula problem, it's a data centralization problem. A district that tracks work orders in one system, capital projects in a spreadsheet, and inspection reports in a filing cabinet will always struggle to produce a defensible FCI not because the math is hard, but because the inputs are scattered.
Getting started, without waiting for a full consultant audit
A few practical steps make FCI usable even for a district without dedicated facilities analytics staff:
- Start with your highest-enrollment or oldest buildings. A perfect FCI across every building matters less than a defensible number on the properties carrying the most risk or the most students.
- Use your existing maintenance history as a starting point, even if incomplete — an FCI based on partial data, clearly labeled as such, is more useful than no number at all.
- Update it annually, not once. FCI is only useful as a trend — a single snapshot tells you where you stand today, but a district tracking it year over year can show a school board whether a facilities investment is actually working.
- Centralize new data going forward, even if historical data is imperfect. Every new work order and inspection logged in one place makes next year's FCI more accurate than this year's.
The bottom line
The Facility Condition Index won't fix a maintenance backlog by itself — no formula does. What it does is turn "our buildings need work" into a number a school board, a bond attorney, or a state funding agency can act on. For districts sitting on a share of that $85 billion national backlog, the first step usually isn't a bigger budget. It's being able to prove, with a defensible number, exactly where that budget needs to go first.
Urbest helps educational institutions centralize work orders, inspections, and maintenance history in one system — the foundation any district needs before an FCI calculation is worth trusting. See how it works for schools.